Lane One Analytics

Race analytics

  1. Race timeline
  2. Calculating splits
  3. Race report
Skip to content
Lane One Analytics
ProductsSwimmer RoadmapSwimming factsExplore dataSign in
Sign inGet started
Lane One Analytics

Race video, times, and comparisons.

Explore dataCreate an account

See your race.
Chase your goal.

Analyze your race video

See your starts, turns, splits, and stroke rate.

Works with your Framed clips

Discover my roadmap

See how close you are to college and Juniors times.

Analytics preview
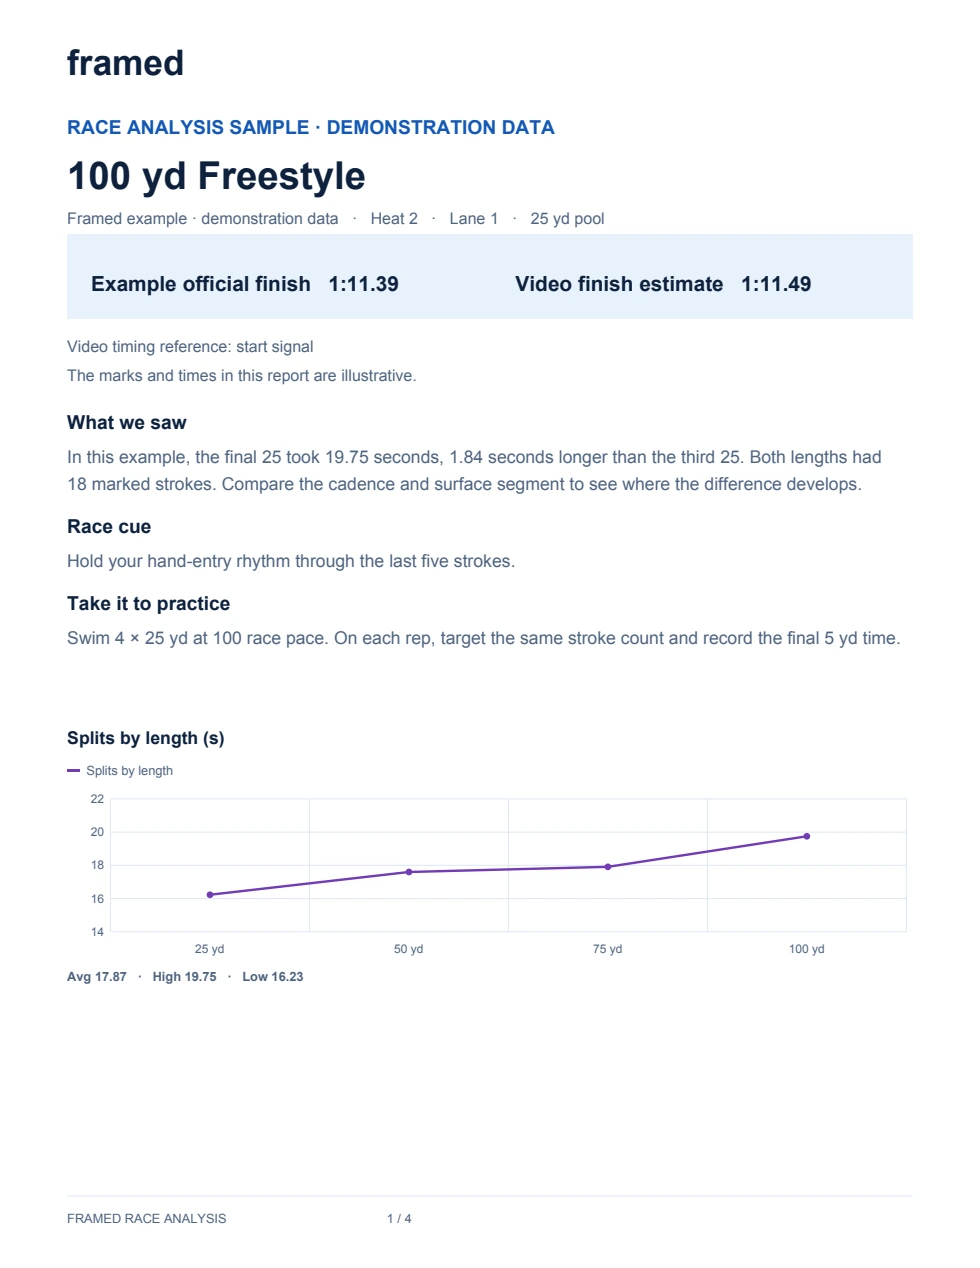
Framed race analysis report, page 1 of 4, Summary

Example report

100 yd Freestyle

Official finish
1:11.39
Video estimate
1:11.49

The final 25 was 1.84 seconds slower than the third 25. Both lengths had 18 marked strokes.

View sample PDF

Did you know?

Explore the research

Men’s 200-yard freestyle

The fastest swimmers held their pace better

2.95 s median slowdown in the second 100 yards for the fastest 10%

Based on 2,484 swims in the fastest group and 7,454 in the slowest group.

How much slower was the second 100?
Fastest 10% of swims2.95 s
Slowest 30% of swims5.93 s

Median difference from the first 100 yards.

Fact 1 of 4